
NAV as of 5/1/2026
$3.21
1 Day NAV Change as of 5/1/2026
$-0.03
CANNABIS RESCHEDULING IS HERE
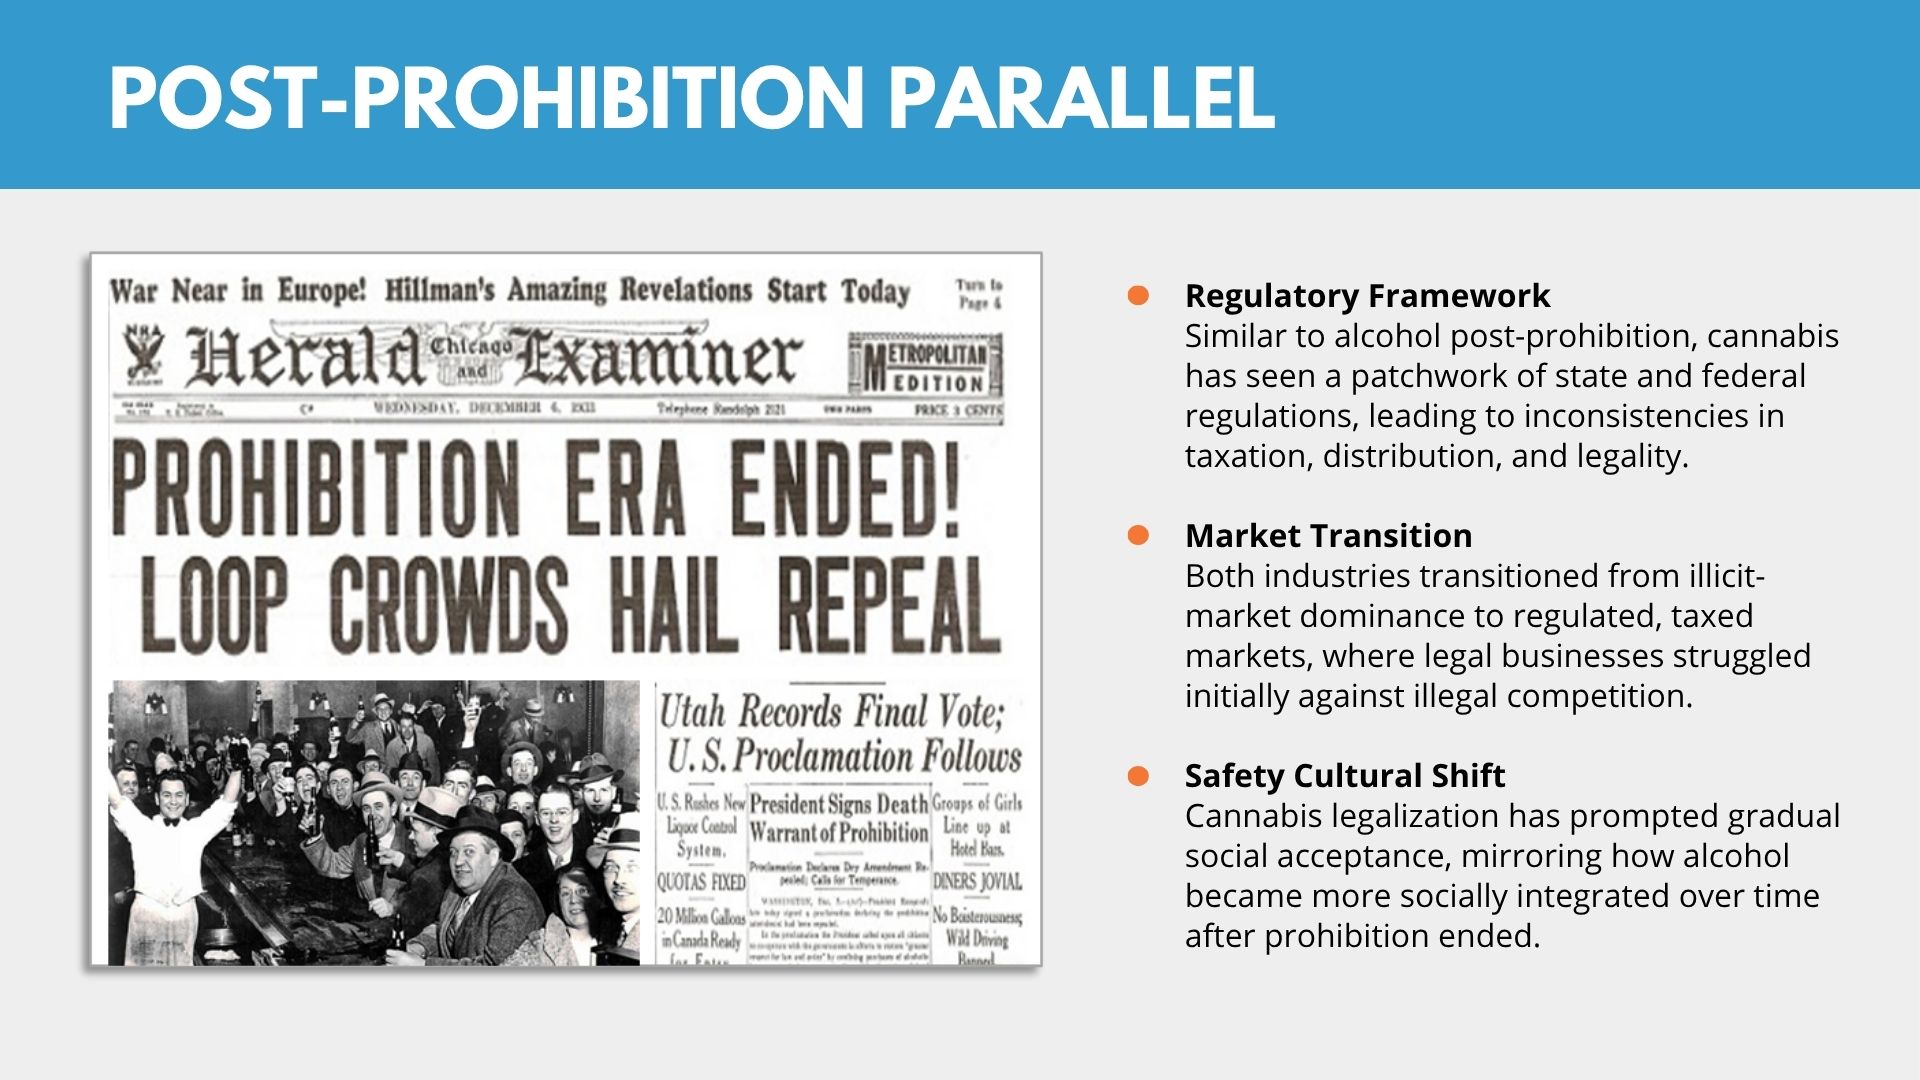
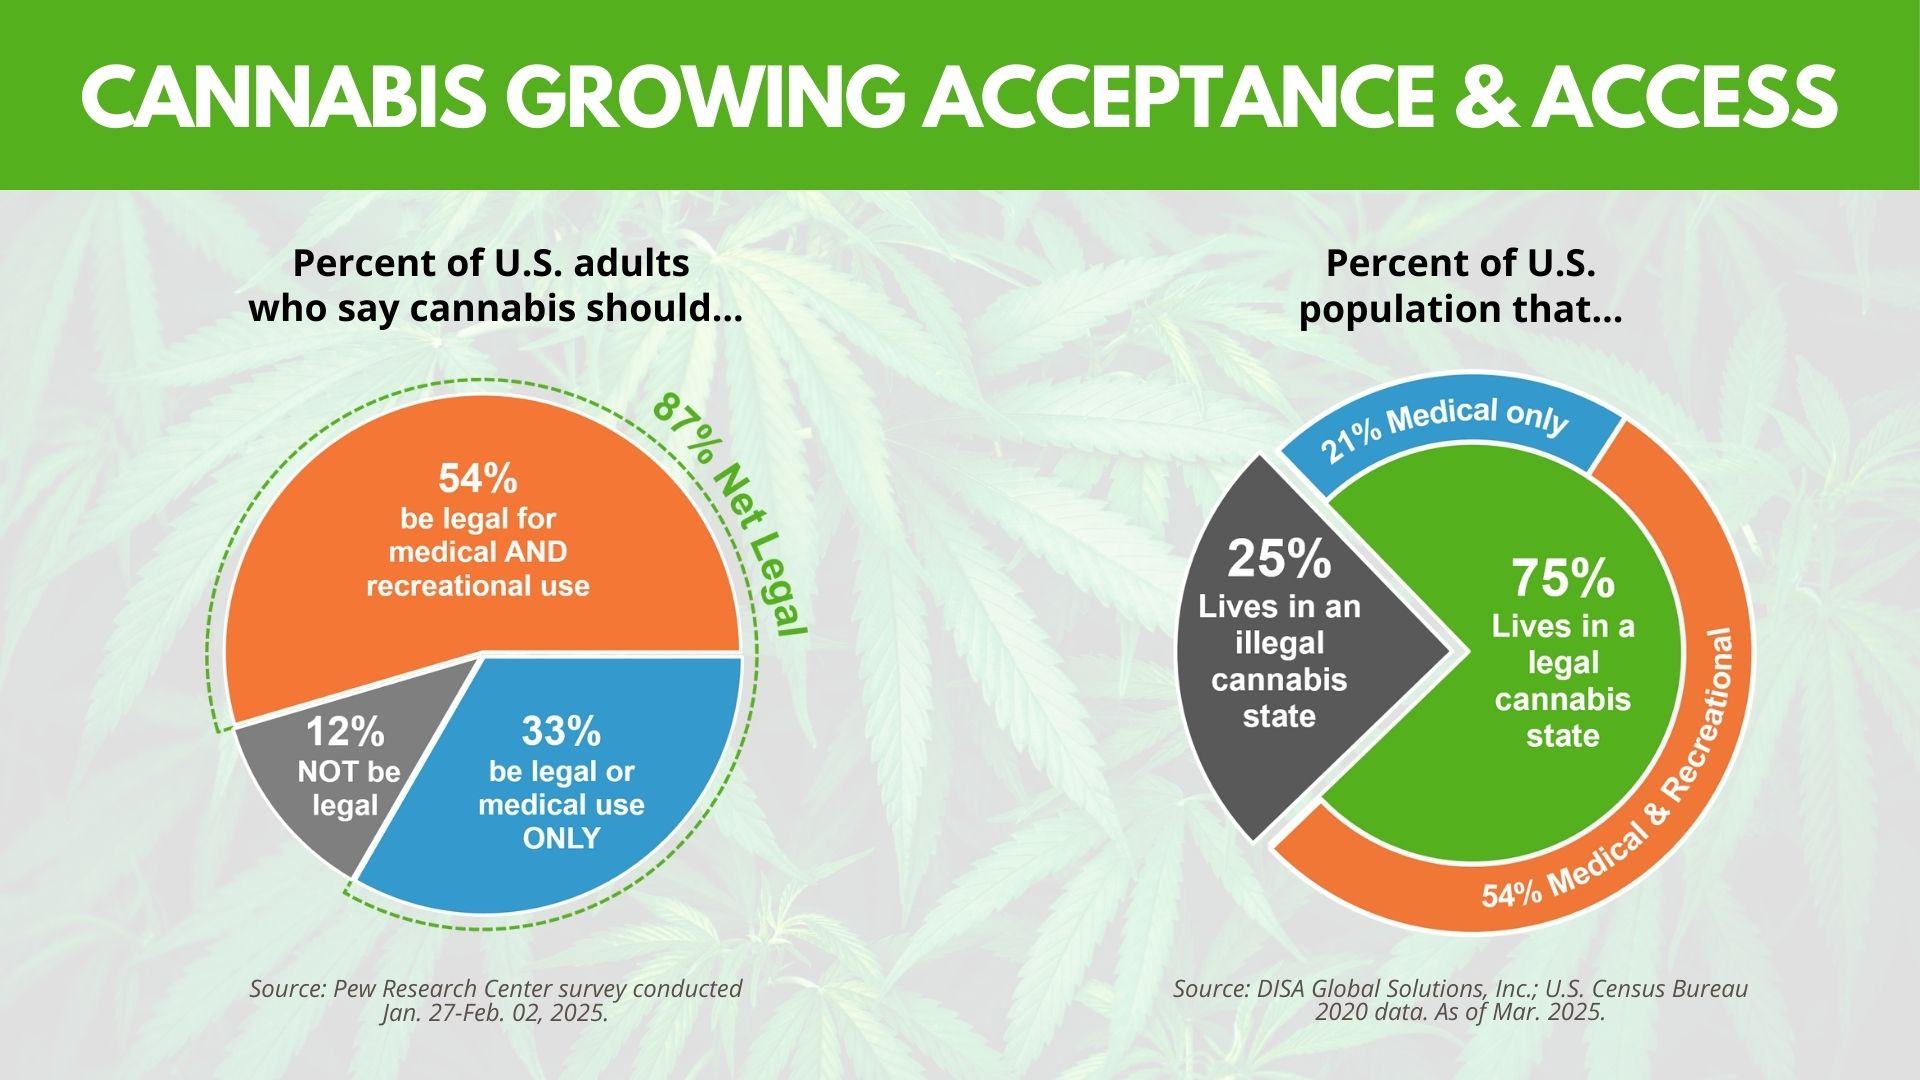
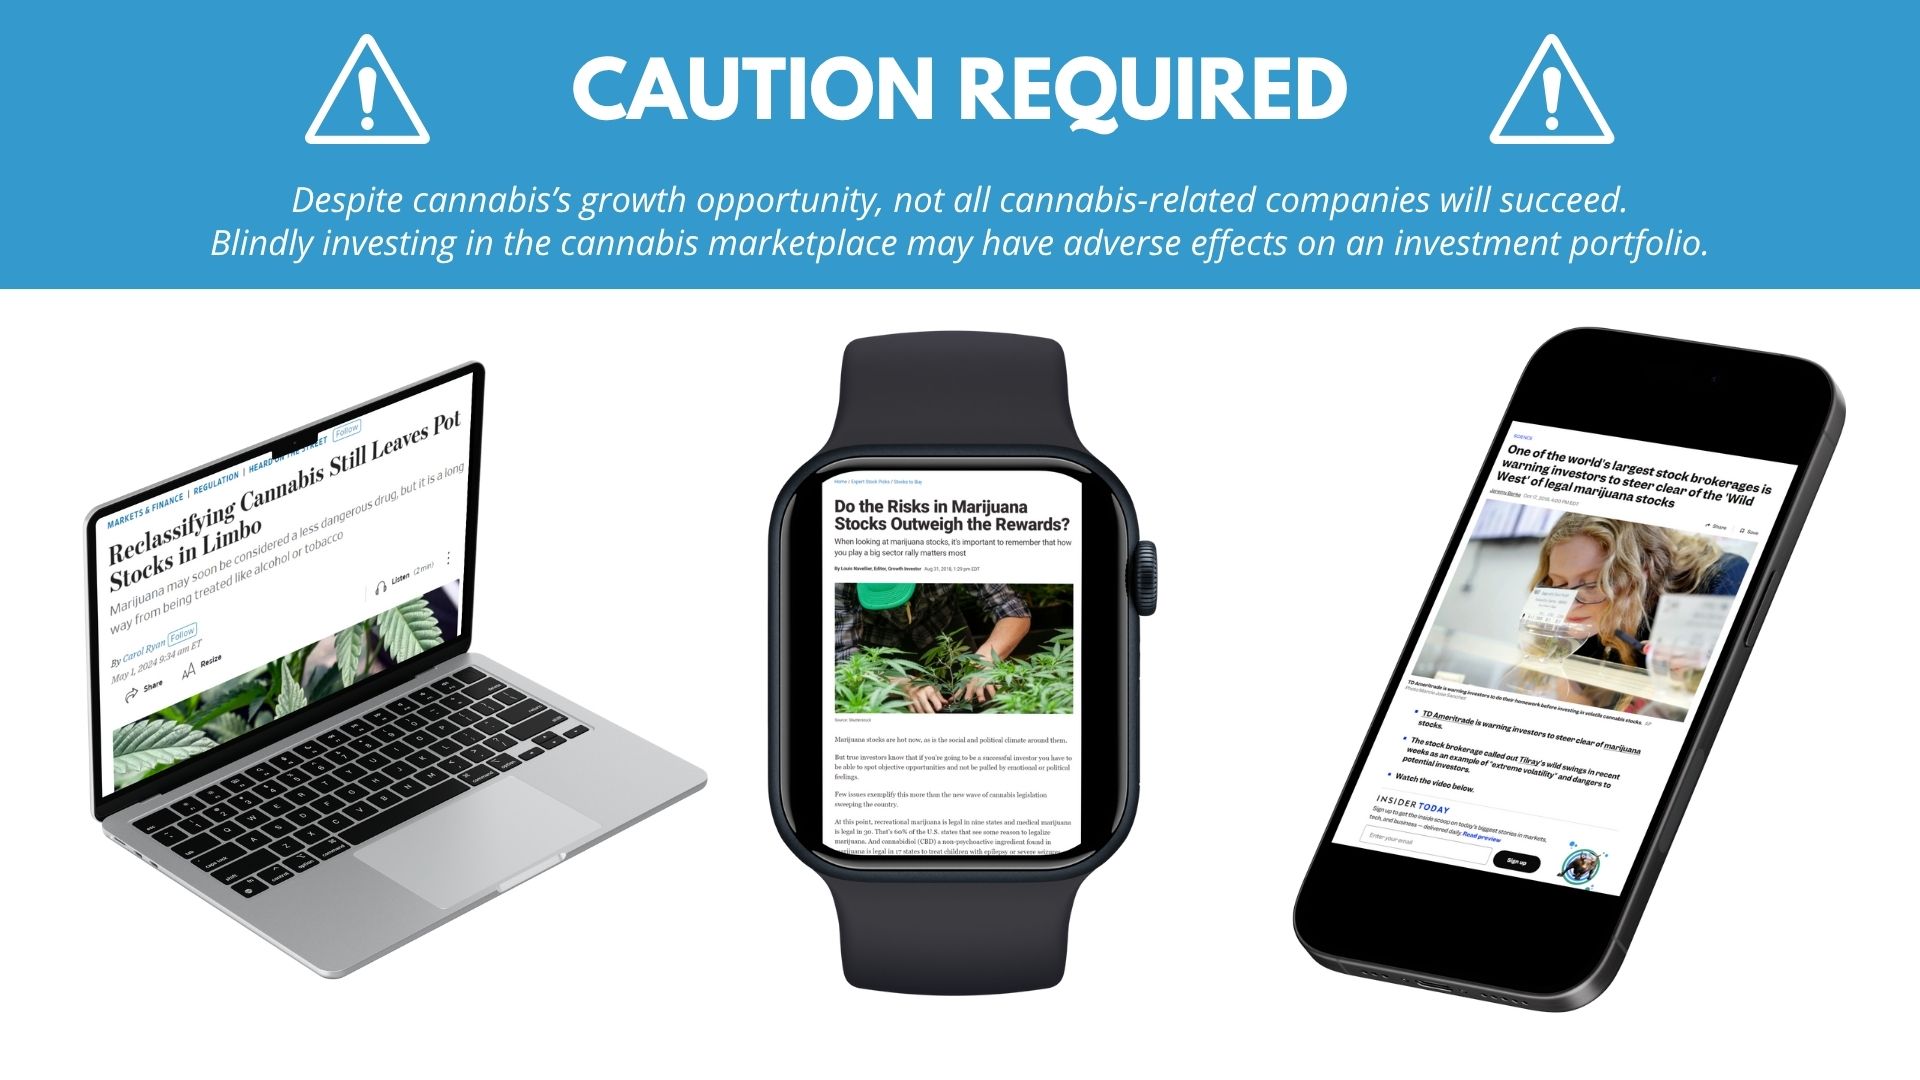
Cannabis rescheduling marks one of the most significant milestones in the industry’s history.
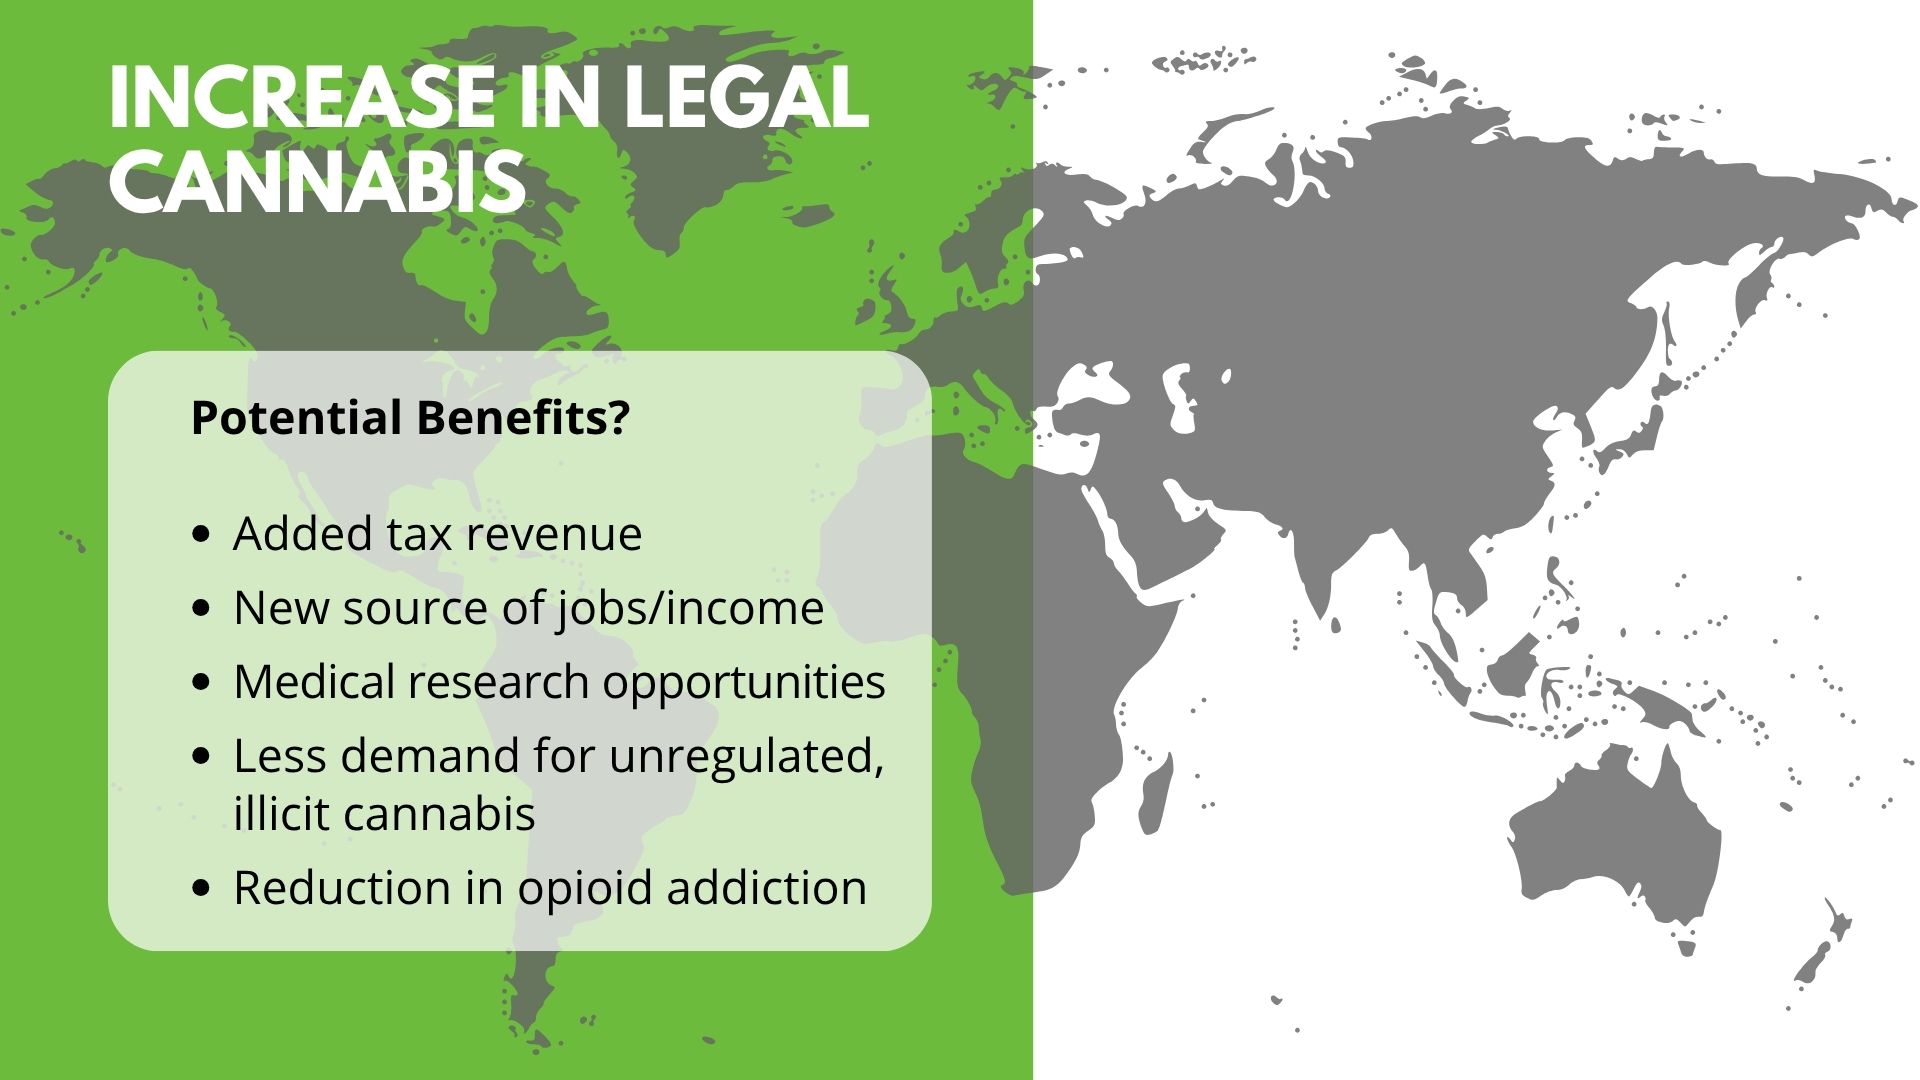
This shift is transforming the landscape for legal operators, unlocking new paths for growth, and opening fresh opportunities for investors to capture the sector’s next stage.
SELF-DIRECTED INVESTORS:
FINANCIAL PROFESSIONALS:
| Symbol | Exchange | Inception Date | CUSIP | NAV | Options Available |
|---|---|---|---|---|---|
| YOLO | NYSE Arca | 4/17/2019 | 00768Y495 | YOLO.NV | Yes |
Why Invest in YOLO?
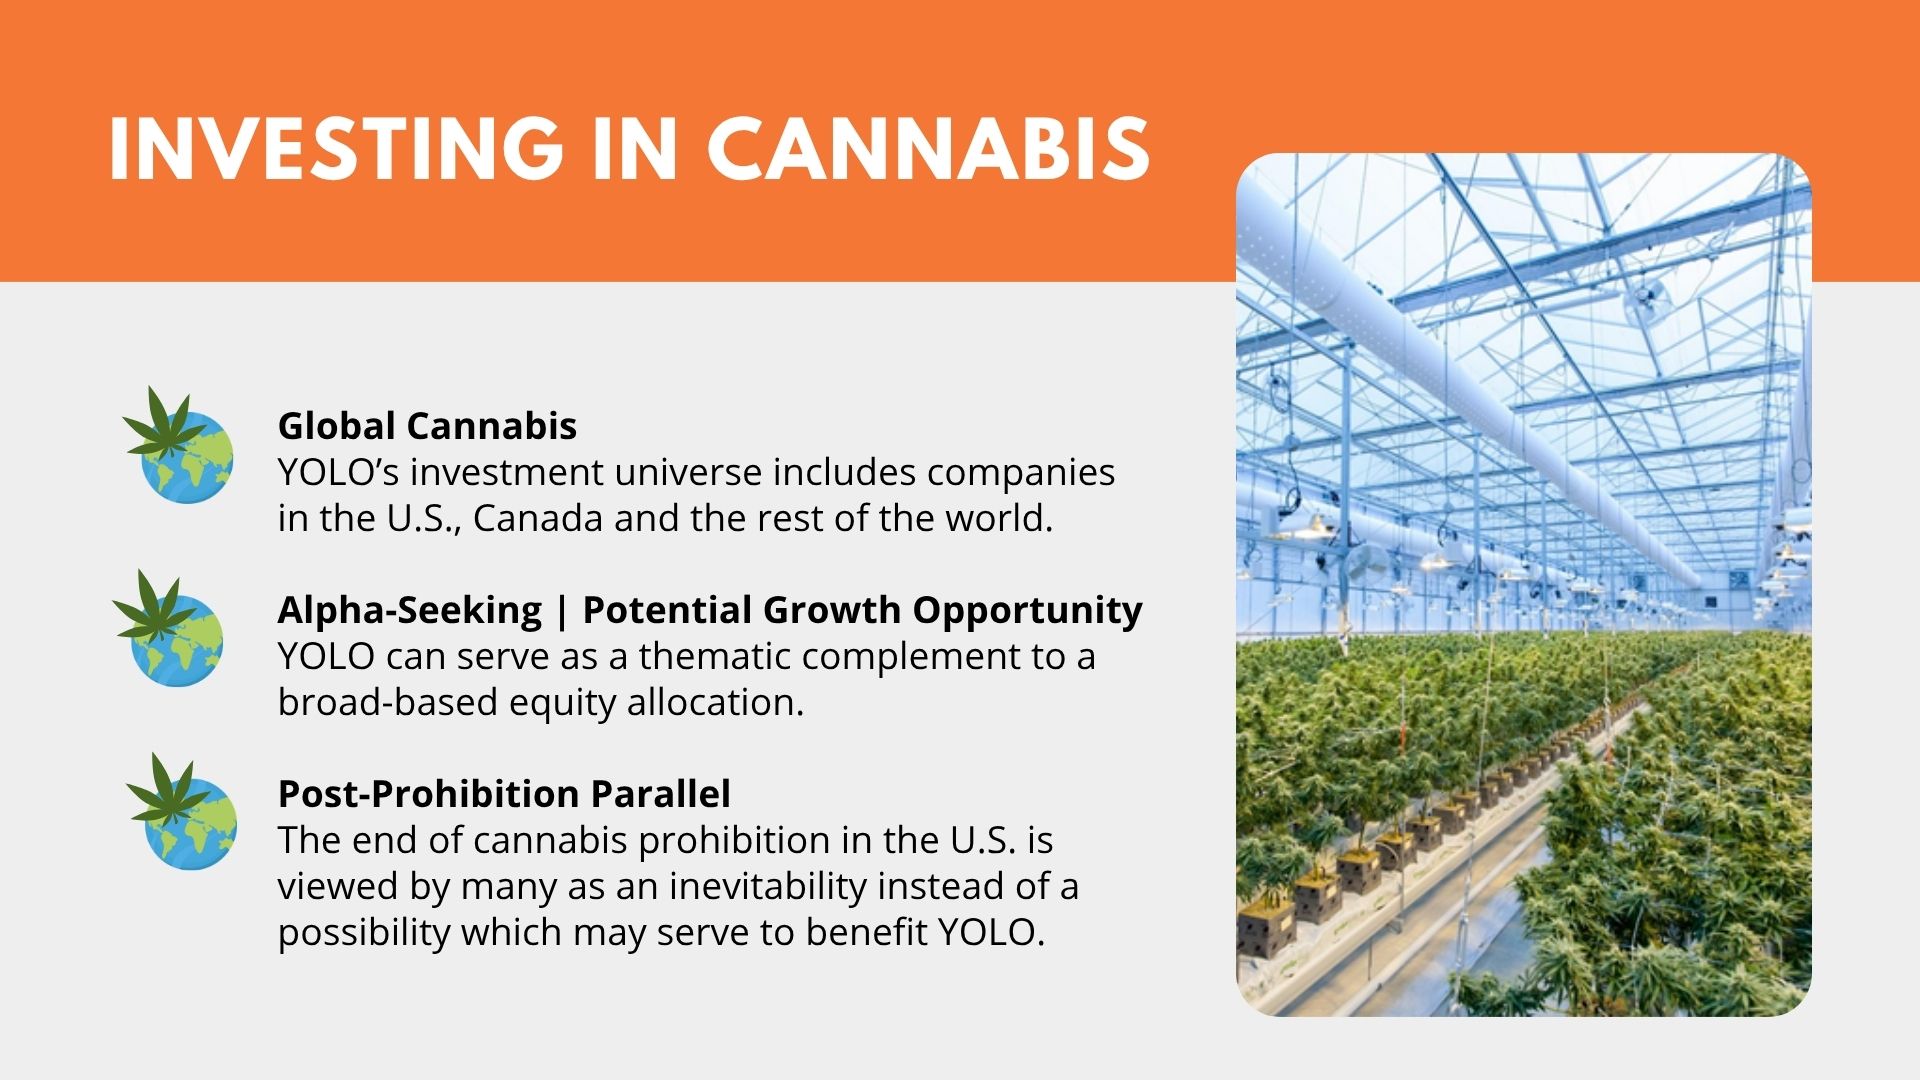
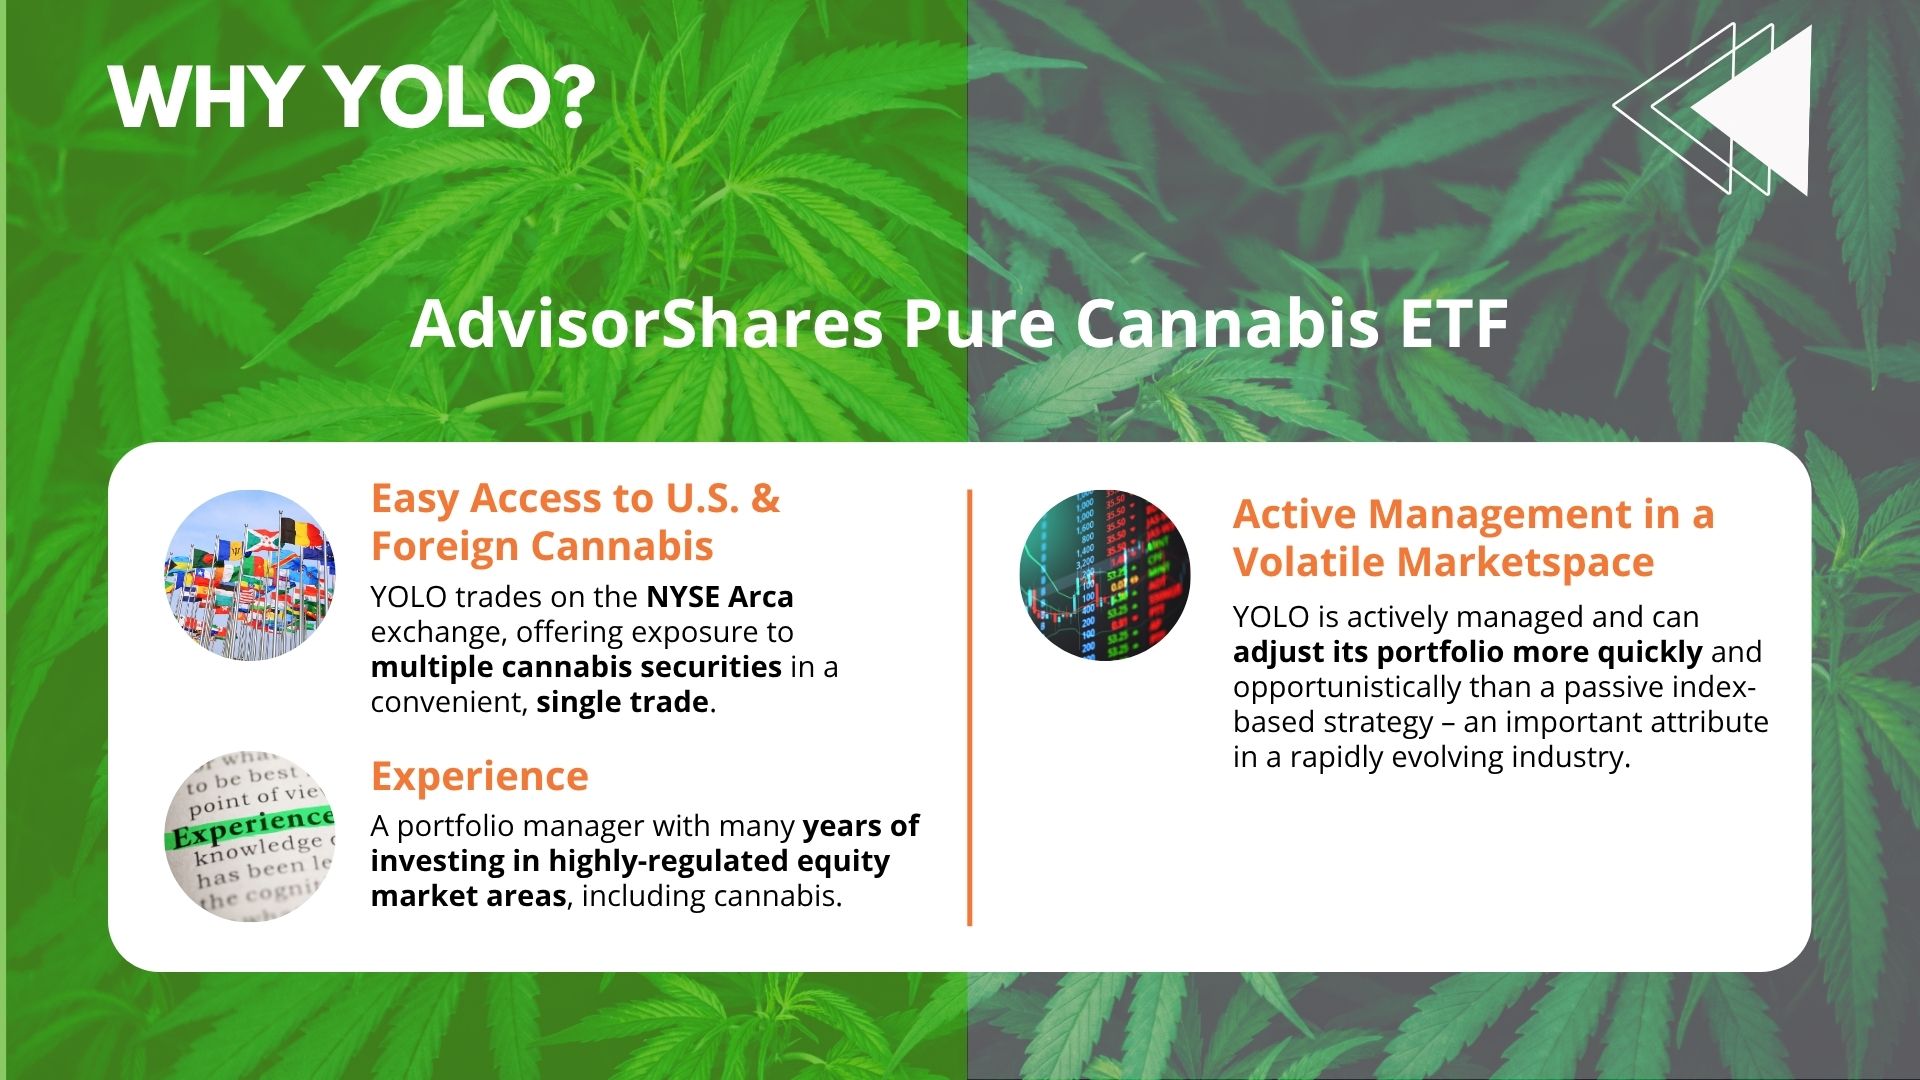
- Long-Term Upside Potential – The emergence of select cannabis securities and their long-term growth potential adds a compelling element for investors seeking pure cannabis exposure and a potential high-growth complement to a broad-based equity allocation.
- First Active ETF with Dedicated Cannabis Exposure – YOLO became the first actively managed ETF with dedicated cannabis exposure available in the U.S., which carries inherent advantages. YOLO can adjust its portfolio more quickly than a passive index-based strategy – an important attribute in a rapidly evolving cannabis marketplace that can witness fluctuations and changes among tradeable equities and an influx of new stock issues.
- Experienced Portfolio Management Team – YOLO’s portfolio management team carries deep experience in the capital markets and a well-established expertise of investing in highly-regulated areas in the equity markets including cannabis. Their risk management and selective approach is an essential feature of YOLO, which does not blindly invest by following a market-cap-weighted index like other cannabis-related ETF offerings.
Where Can YOLO Fit in a Traditional Portfolio?
YOLO can deliver an alpha-seeking, high-growth complement or satellite equity holding to a broad-based equity allocation. YOLO can be used as a buy-and-hold strategy for investors seeking dedicated cannabis exposure for an equity portfolio.
Key Attributes
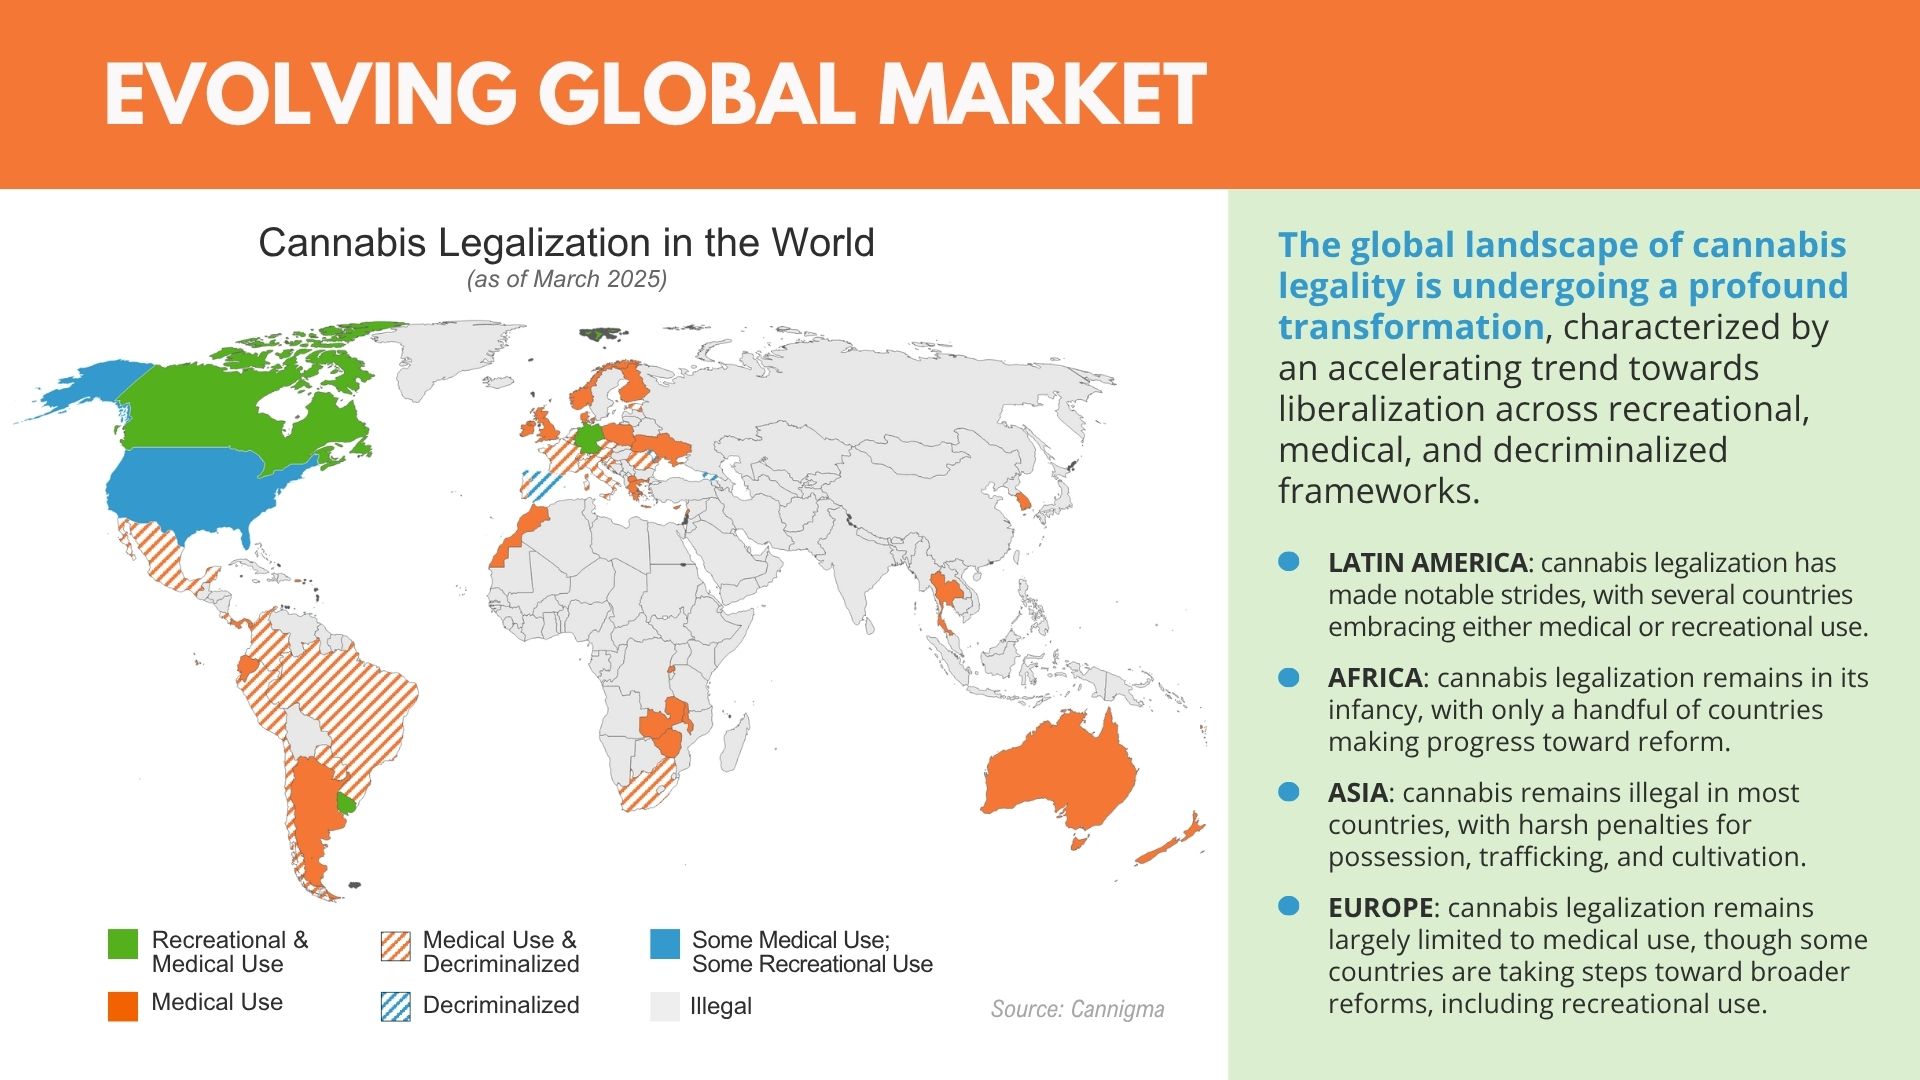
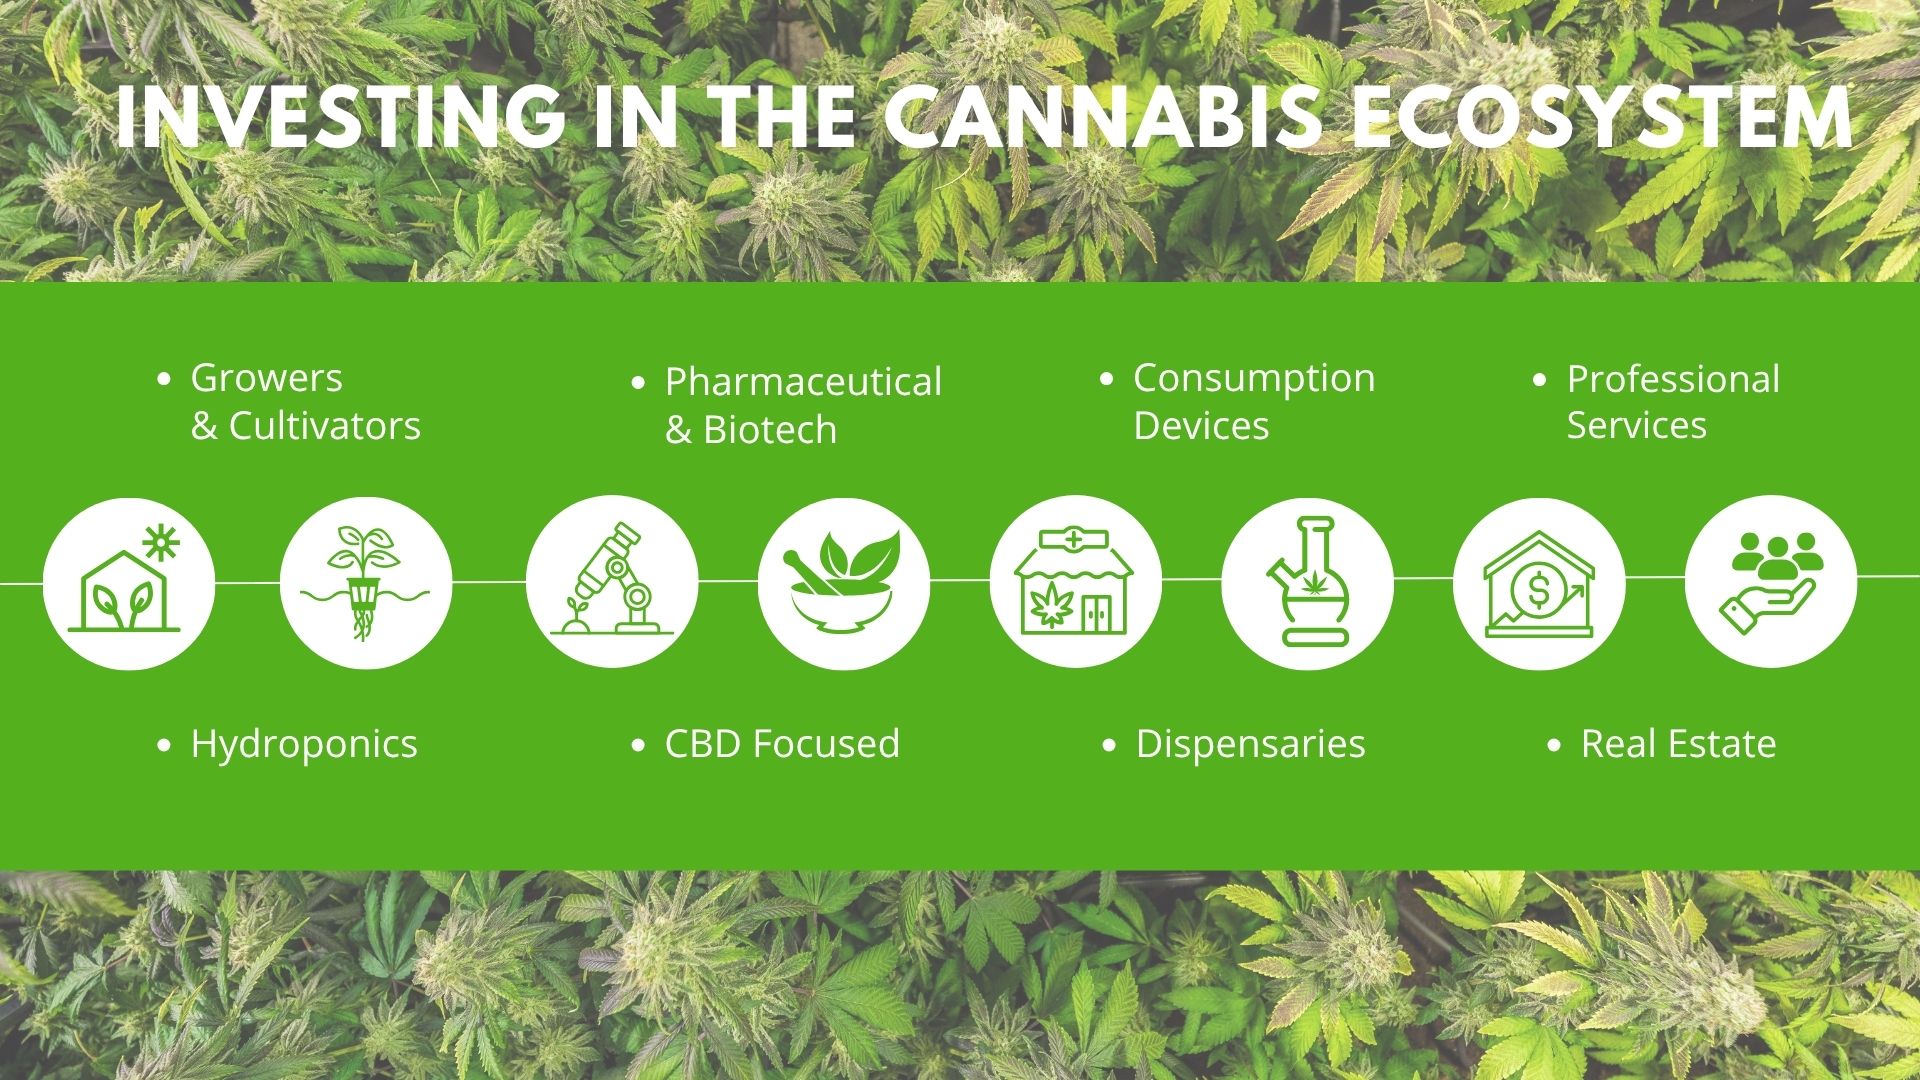
- Dedicated Cannabis Exposure Including Consumer Product Companies – The portfolio manager allocates across a universe of investable cannabis companies primarily in the U.S. and Canada engaging in legal business that span different industries, including those specializing in consumer products.
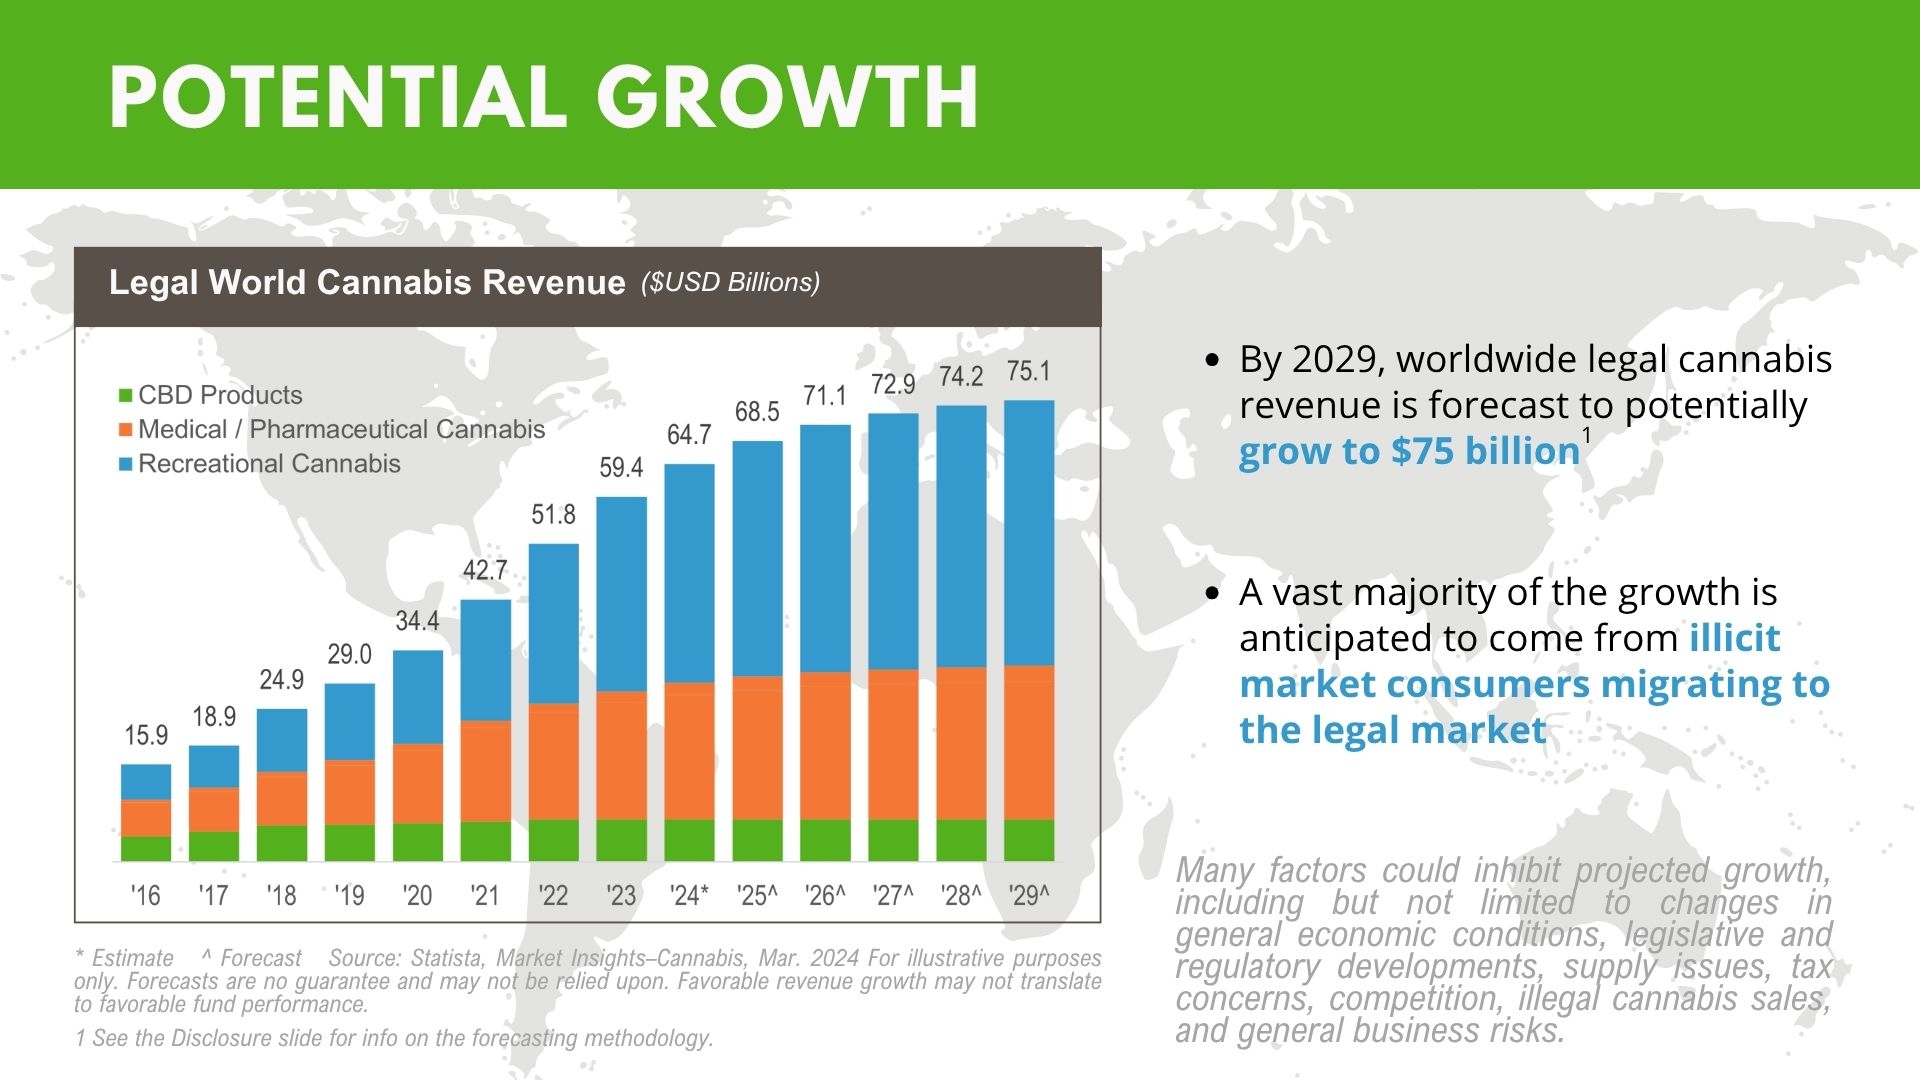
- Emerging Growth Opportunity – Cannabis securities span multiple industries including agriculture, biotechnology, pharmaceutical, real estate, retail, finance, and other medical applications. The portfolio manager believes that an evolving landscape of select, cannabis-related companies may provide upside potential that may lead to attractive growth opportunities.
- Merger & Acquisition Potential – Due to their emerging growth opportunity, companies involved in legal cannabis-related business both in the U.S. and Canada may benefit from potential merger and acquisition activity as the market matures and evolves.
About the Portfolio Manager
Dan Ahrens, Portfolio Manager
Mr. Ahrens is a Managing Director and the Chief Operating Officer of AdvisorShares. He is the portfolio manager of several AdvisorShares ETFs: the Pure US Cannabis ETF (ticker: MSOS) – the first and only ETF to offer exclusive US-exclusive cannabis exposure, the MSOS Daily Leveraged (ticker: MSOX), the Pure Cannabis ETF (ticker: YOLO), the Vice ETF (ticker: VICE), the Hotel ETF (ticker: BEDZ), the Restaurant ETF (ticker: EATZ), and the Psychedelic ETF (ticker: PSIL).
He carries over two decades of experience in the financial services industry serving in a variety of senior-level capacities and is the author of Investing in Cannabis (Wiley, 2020) and Investing in Vice (St. Martin’s Press, 2004). Additionally, Mr. Ahrens has appeared on numerous financial programs including CNBC, CNN, Fox Business, ABC News and Bloomberg and has been featured, along with funds under his management in major national and trade publications including The Economist, the New York Times, Financial Times, and The Wall Street Journal.


YOLO Overview from Dan Ahrens
Get an introduction to the YOLO ETF directly from the portfolio manager, Dan Ahrens.
YOLO Overview from Dan Ahrens
Get an introduction to the YOLO ETF directly from the portfolio manager, Dan Ahrens.
Fund
Price History
Fund Data
5/1/2026| NAV | $3.21 |
| Change | $-0.03 |
| Shares Outstanding | 11,720,000 |
| Assets Under Management | $37,642,780.22 |
Market Data
5/4/2026| Closing Price | $3.06 |
| Close Change | $-0.12 |
| Volume | 20,947 |
Regulatory Data
5/4/2026| Premium Discount | $-0.02 |
| 30-Day Median bid-ask Spread | 2.469136 |
Shares are bought and sold at market price (closing price) not NAV and are not individually redeemed from the Fund. Market price returns are based on the midpoint of the bid/ask spread at 4:00 pm Eastern Time (when NAV is normally determined), and do not represent the return you would receive if you traded at other times.
")
FUND
Characteristics
As of 3/31/2026
Source: Morningstar & AdvisorShares *Fund Characteristics Do Not Include Cash
Get Social @AdvisorShares
Join the conversation on social media to hear more from the portfolio manager, get informed about upcoming events and webinars, and more!
FUND
Performance
As of 3/31/2026
| NAV | Market Price Return | North American Marijuana Index | S&P 500 Index | |
|---|---|---|---|---|
| 1 Month | -11.04 | -12.04 | -5.55 | -4.98 |
| 3 Months | -18.56 | -19.57 | -8.24 | -4.33 |
| YTD | -18.56 | -19.57 | -8.24 | -4.33 |
| 1 Year | 51.38 | 49.43 | 23.02 | 17.80 |
| 3 Year | -1.76 | -2.14 | -8.51 | 18.32 |
| 5 Year | -34.22 | -34.51 | -32.30 | 12.06 |
| Since Inception (4/17/2019, Annualized) | -25.84 | -26.02 | -27.04 | 14.14 |
As of 3/31/2026
| NAV | Market Price Return | North American Marijuana Index | S&P 500 Index | |
|---|---|---|---|---|
| 1 Month | -11.04 | -12.04 | -3.43 | -4.98 |
| 3 Months | -18.56 | -19.57 | -20.54 | -4.33 |
| YTD | -18.56 | -19.57 | -2.59 | -4.33 |
| 1 Year | 51.38 | 49.43 | -2.59 | 17.80 |
| 3 Year | -1.76 | -2.14 | -10.62 | 18.32 |
| 5 Year | -34.22 | -34.51 | -26.37 | 12.06 |
| Since Inception (4/17/2019, Annualized) | -25.84 | -26.02 | -26.95 | 14.14 |
Performance data quoted represents past performance and is no guarantee of future results. All Fund data and performance data quoted is believed to be accurate, and unless otherwise stated, is sourced from the Fund administrator, the Advisor’s or Sub-Advisor’s proprietary data, and Morningstar. Current performance may be lower or higher than the performance data quoted. Investment return and principal value will fluctuate so that an investor’s shares, when redeemed, may be worth more or less than original cost. Returns less than one year are not annualized. The S&P 500 Index is a broad-based, unmanaged measurement of changes in stock market conditions based on the average of 500 widely held common stocks. The North American Cannabis Index tracks the performance of a basket of North American publicly listed companies with significant business activities in the marijuana industry.
Fund
| Date | Account Symbol | Stock Ticker | Security ID | Security Description | Shares | Share Price | Market Value | Portfolio Weight | Asset Group |
|---|---|---|---|---|---|---|---|---|---|
| 05/04/2026 | YOLO | MSOS | 00768Y453 | ADVISORSHARES PURE US CANN | 4,173,664 | 4.84 | 20,200,533.76 | 55.27% | MF |
| VFF | 92707Y108 | VILLAGE FARMS INTERNATIONAL | 2,029,626 | 2.78 | 5,642,360.28 | 15.44% | FS | ||
| HITI | 42981E401 | HIGH TIDE INC | 1,300,774 | 2.42 | 3,147,873.08 | 8.61% | FS | ||
| CWEB | BGHY2B1 | CHARLOTTES WEB HOLDINGS INC | 2,876,805 | 0.54 | 1,543,202.89 | 4.22% | FS | ||
| OGI | 68617J100 | ORGANIGRAM GLOBAL INC | 947,440 | 1.39 | 1,316,941.60 | 3.60% | FS | ||
| SNDL | 83307B101 | SNDL INC | 884,085 | 1.42 | 1,255,400.70 | 3.43% | FS | ||
| CRON | 22717L101 | CRONOS GROUP INC | 442,394 | 2.65 | 1,172,344.10 | 3.21% | FS | ||
| ACB | 05156X850 | AURORA CANNABIS INC | 171,110 | 3.42 | 585,196.20 | 1.60% | FS | ||
| ROMJF | 78112W100 | RUBICON ORGANICS INC | 1,498,936 | 0.37 | 554,906.11 | 1.52% | FS | ||
| TLRY | 88688T209 | TILRAY BRANDS INC | 56,263 | 5.90 | 331,951.70 | 0.91% | S | ||
| LOVE | BMZMHL4 | CANNARA BIOTECH INC | 247,894 | 1.29 | 318,782.01 | 0.87% | FS | ||
| CGC | 138035704 | CANOPY GROWTH CORP | 289,683 | 1.10 | 318,651.30 | 0.87% | FS | ||
| CNTMF | 34380L102 | FLUENT CORP | 6,194,547 | 0.02 | 136,280.03 | 0.37% | FS | ||
| PCLOF | 71716K101 | PHARMACIELO LTD | 308,085 | 0.04 | 12,548.30 | 0.03% | FS | ||
| X9USDBLYT | BLACKROCK TREASURY TRUST INSTL 62 | 81,486.11 | 1.00 | 81,486.11 | 0.22% | MM | |||
| CASH | -68,765.75 | 100.00 | -68,765.75 | -0.19% | CA |
FUND
Fees & Expenses
Annual Fund Operating Expenses (expenses that you pay each year as a percentage of the value of your investment)
| Management Fee* | 0.37% | |
| Other Expenses | 0.54% | |
| Gross Expense Ratio | 0.91% | |
| Fee Waiver/Expense Reimbursement* | -0.40% | |
| Net Expense Ratio | 0.51% |
| Expense Cap Limitation* | 0.74% |
*The Fund’s advisory fee is 0.60% less the acquired fund fees and expenses related to any investment in AdvisorShares Pure US Cannabis ETF (“MSOS”); therefore, the acquired fund fees and expenses related to any investment in MSOS by the Fund serve to reduce the amount of the advisory fee and are not included in the expenses in this table because they are not an expense of the Fund. The Advisor has contractually agreed to keep net expenses from exceeding 0.74% of the Fund’s average daily net assets for at least one year from the date of the prospectus. For more information, please read the full prospectus.
Last Ten
Fund Distributions
")

Before investing you should carefully consider the Fund’s investment objectives, risks, charges and expenses. This and other information is in the prospectus and summary prospectus. Please read the prospectus and summary prospectus carefully before you invest. Foreside Fund Services, LLC, Distributor.
The Fund is subject to a number of risks that may affect the value of its shares. This section provides additional information about the Fund’s principal risks. The degree to which a risk applies to the Fund varies according to its investment allocation. Each investor should review the complete description of the principal risks before investing in the Fund. As with investing in other securities whose prices increase and decrease in market value, you may lose money by investing in the Fund.
Cannabis-Related Company Risk. Cannabis-related companies are subject to various laws and regulations that may differ at the state/local and federal level. These laws and regulations may (i) significantly affect a cannabis-related company’s ability to secure financing, (ii) impact the market for marijuana industry sales and services, and (iii) set limitations on marijuana use, production, transportation, and storage. Cannabis-related companies may also be required to secure permits and authorizations from government agencies to cultivate or research marijuana. In addition, cannabis-related companies are subject to the risks associated with the greater agricultural industry, including changes to or trends that affect commodity prices, labor costs, weather conditions, and laws and regulations related to environmental protection, health and safety. Cannabis-related companies may also be subject to risks associated with the biotechnology and pharmaceutical industries. These risks include increased government regulation, the use and enforcement of intellectual property rights and patents, technological change and obsolescence, product liability lawsuits, and the risk that research and development may not necessarily lead to commercially successful products.
Shares are bought and sold at market price not net asset value (NAV) and are not individually redeemed from the Fund. Market price returns are based on the midpoint of the bid/ask spread at 4:00 pm Eastern Time (when NAV is normally determined) and do not represent the return you would receive if you traded at other times.
ETF
Social
Conversation